Executive Summary
Edumine is a smart school management system to manage school-related data and transactions with data science, artificial intelligence, and machine learning. Edumine consists of a storage unit, data mining engine, and analytic showcase. It contains an extensive conduct system for students, staff, teachers, student’s parents, managerial staff, etc. Maintaining school information is a big challenge various approaches are used to effectively manage such types of clerical works.
An Effective Storage Unit
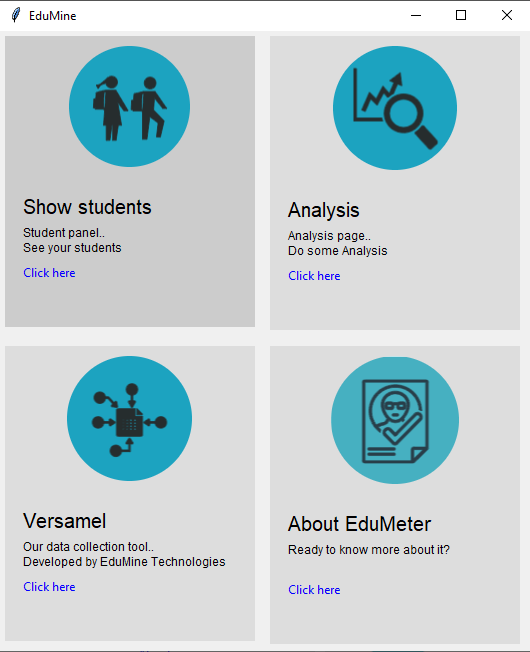
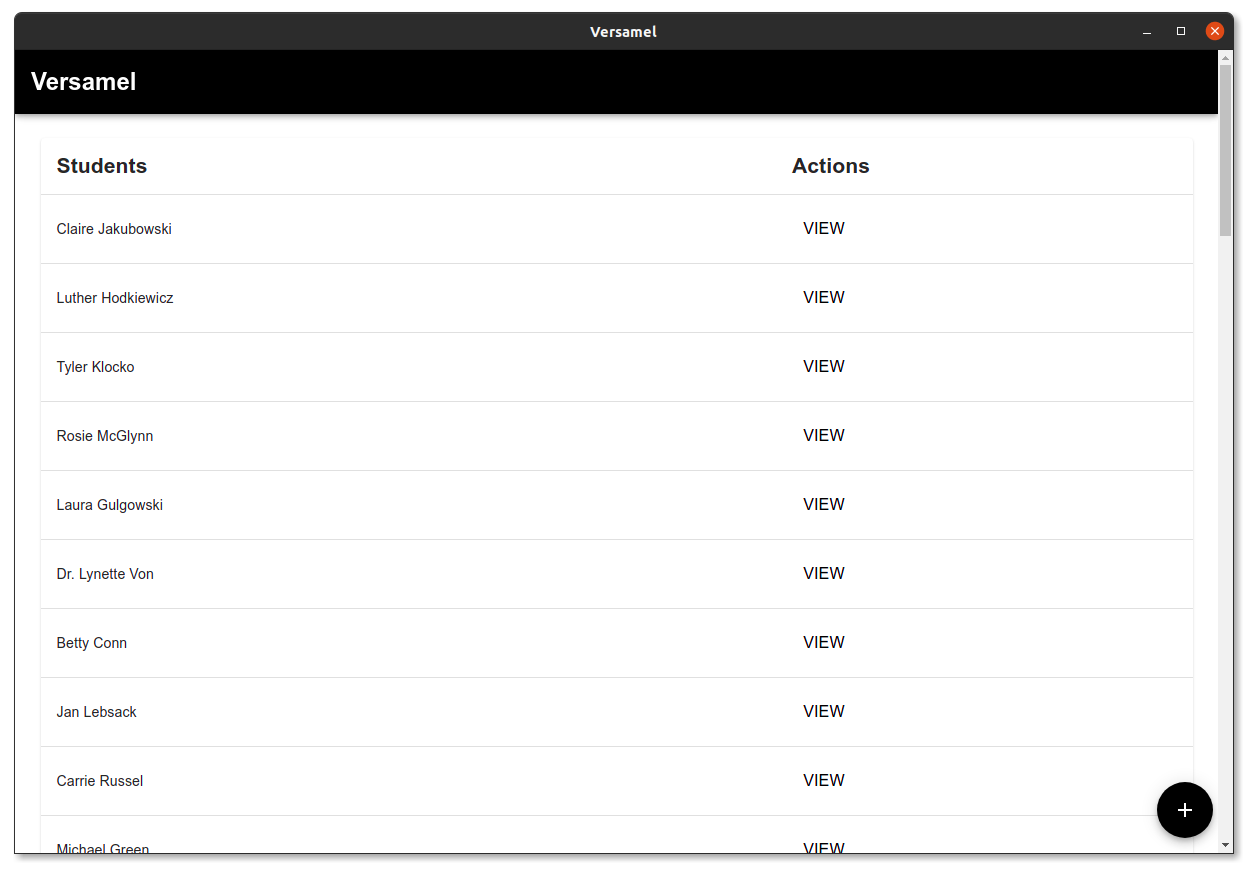
EduMine comes with Versamel, a software developed by our company. Versamel is a simple, intuitive, and smart data collection tool made for schools. It encodes a student's sociodemographic and academic data on excel sheets.
A smart school management system
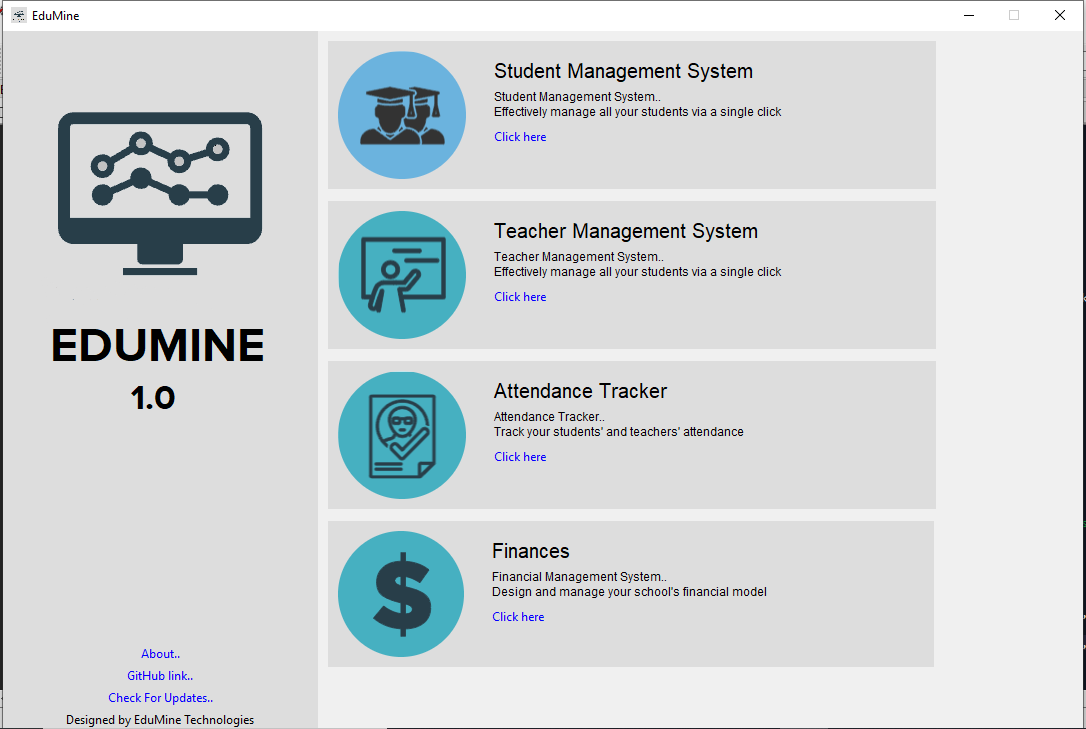
EduMine is a fully integrated school management system. EduMine computerizes clerical jobs like student management, teacher evaluation and management, attendance tracking, finance management and more. Helping administrators and parents have a wider view of the teaching-learning process.
A data analysis engine
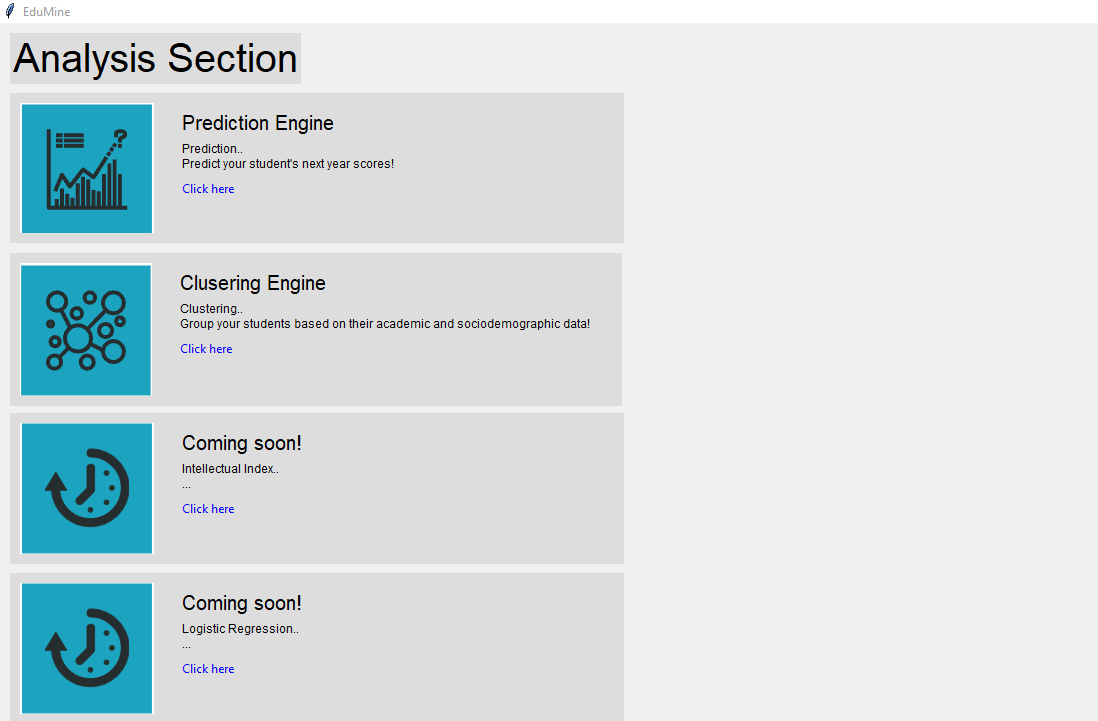
EduMine is built on advanced machine learning capabilities. Once the student data has been encoded in to digital form. You can use EduMine to have a deeper understanding of a student both individually and as a class. EduMine's data analysis engine has two parts The Prediction Engine and The Clustering Engine. Let's see them independently with an example.
Prediction Engine
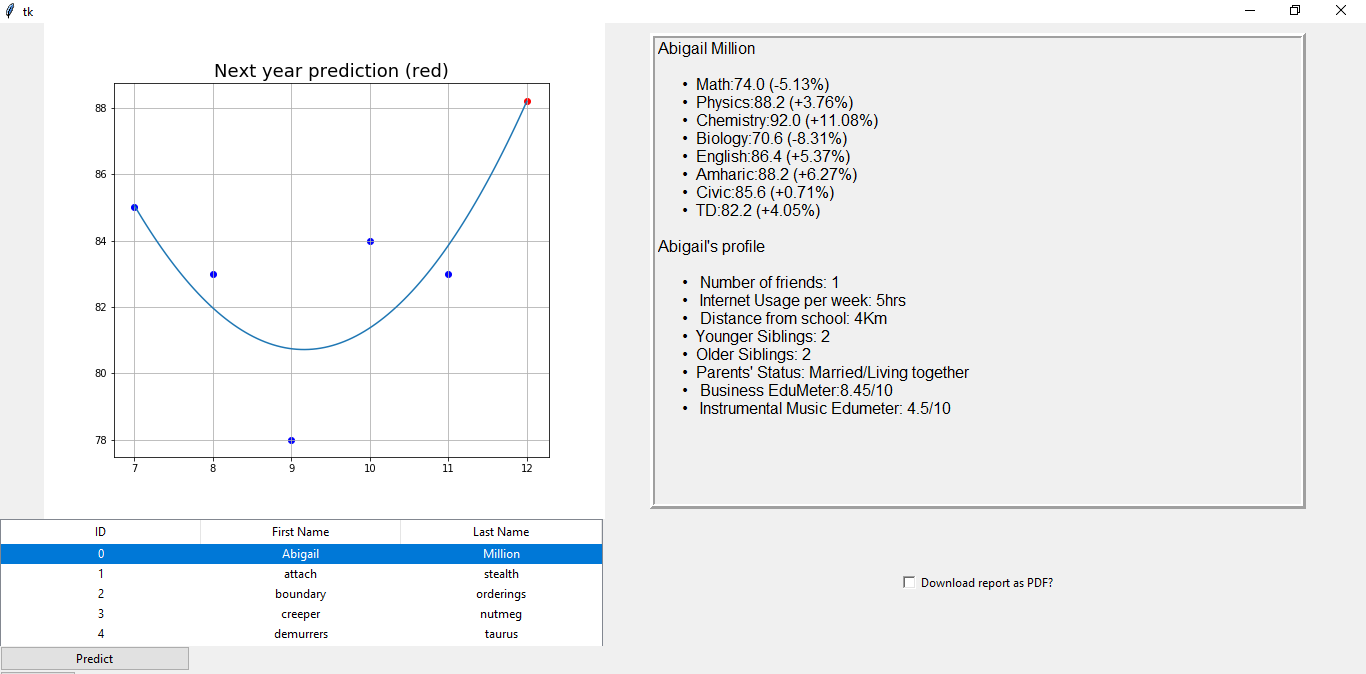
In the image to the left we can see EduMine showing the prediction result of a student named Abigail Million. We can see from the graph that Abigail's score's has been decreasing from grade 7 to 9, but from 9 to 12 her scores start increasing. The red dot on the graph shows the next year's predicted result which in this case shows that her scores will keep increasing. The x-axis on the graph shows the grade and they y-axis shows the scores. In the textual representation to the right of the graph we can see the exact percentages in which her score in each subject will increase.
Clustering Engine
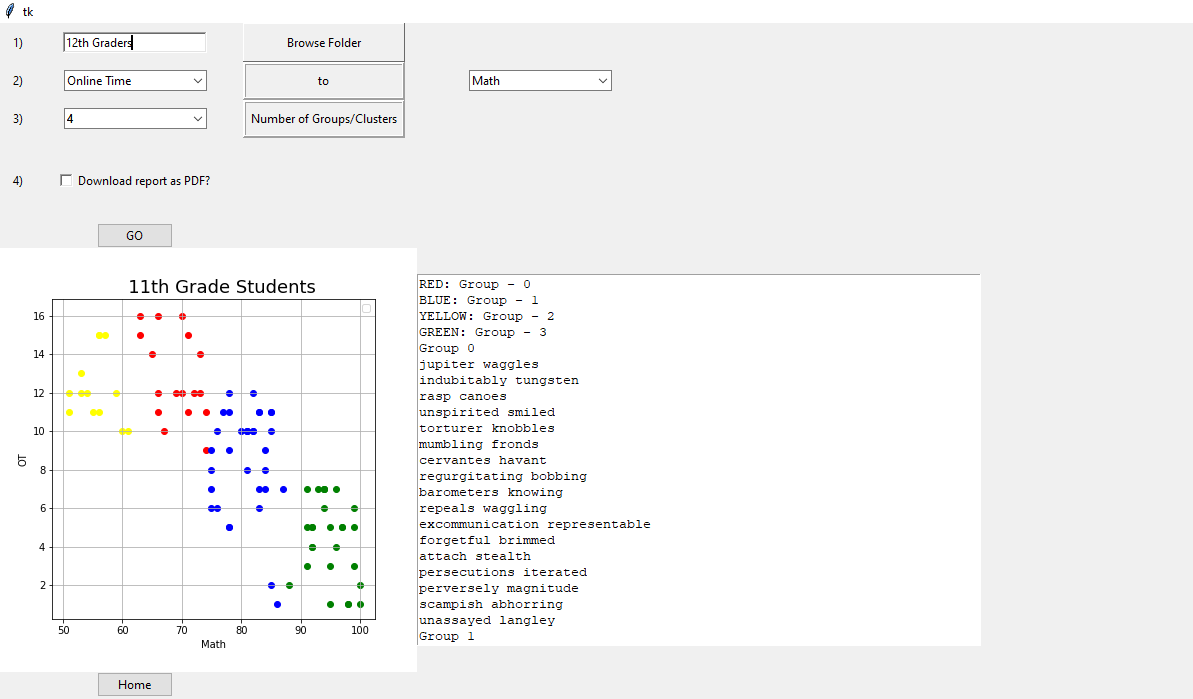
In the image to the left we can see EduMine showing the clustering result of all grade 11th students. Clustering allows us to group students based on two parameters. In this case the parameters are online time (the time a student spends online per week) and Math (the Math result of a student in the given year). Based on these parameters EduMine has separated the students in to four(4) clusters. The y-axis in the graph corresponds to online time and the x-axis corresponds to their Math score. Each point corresponds to a student. For example let's look at the yellow group, we can see that they scored low on their math tests and their online time is high. We can concluded that the time they spend online has impeded them from scoring high in the test.
About EduMine Technologies
Founded in 2019
The first to inaugurate the EduMeter project in collaboration with MinT and KOICA.
THE EDUMINE TEAM

Nebyu Elias
CEO
Fraol Lemecha
CTO
Muferiha Abdulbasit
CFOReady to know more about your students?
Find Us At
Tracon Building, 6th floor, MinT Startup Incubation Programme